Headshot
CASEY JUSTUS

Portfolio Site

I am a senior at Cornell University majoring in Information Science and Systems Technology.

Within this major, my primary concentration is Data Science and my secondary concentration is Networks, Crowds, and Markets. Additionally, I am pursuing a minor in Business for Engineers. Leveraging my course of study, I hope to combine my passion for coding with the world of business, and study how technology affects markets and cognitive behavior. I hope to gain real world experience in data analytics and predictive techniques to further my understanding of the role data plays in business.
I also play Division I volleyball for Cornell University, and devote much of my time to practicing, playing, working out, and traveling with the team.

Sales Projections

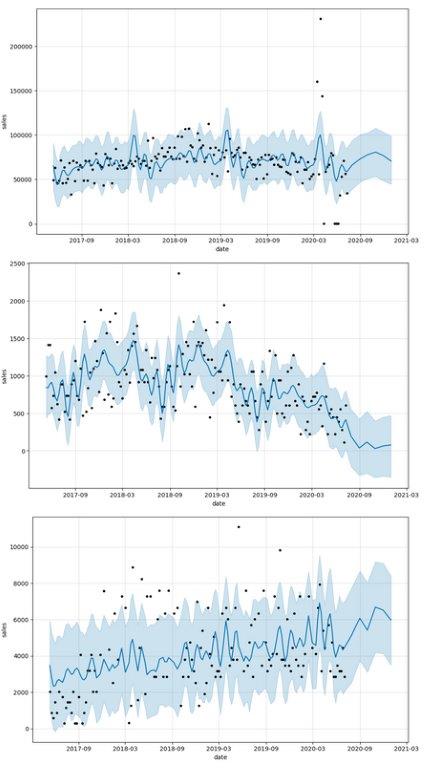
I created 15 separate time-series 6-month sales projections for specific customer accounts and products using Python and an Azure Data Warehouse in Databricks. After connecting to an Azure Data Warehouse, querying databases using Python and SQL, implementing Facebook's Prophet Model, and running cross-validations, I was able to produce sales forecasts, seasonality trends, and performance metrics with small error. These forecasts are based on 5 products and 3 customer accounts at a large pharmeceutical company I interned at. Due to privacy concerns, I am unable to share the code on GitHub, but I have linked the button below to photos of the graphs and trends I produced.

Musical Note Classification

With the help of 3 partners, I developed four models to classify musical notes (whole, half, quarter, and sixteenth notes) using logistic regression, histogram gradient boosting trees, fully-connected neural networks, and convolutional neural networks algorithms. We applied these algorithms to 28x28 and 64x64 images for classification based on the grayscale pixel values. The most accurate model achieved a test accuracy of 0.9617 on the 28x28 images and 0.9599 on the 64x64 images using cross-validation. Then using our different analyses we looked into how the runtime was affected by the method as well as parameter selection used.

Election Prediction

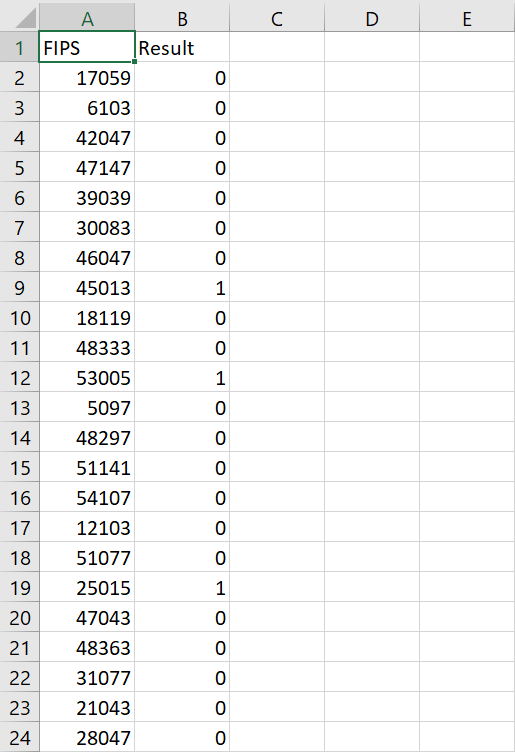
I, along with two partners, created a Neural Network using Scikit-Learn's Grid Search model selection to produce a binary prediction (Democratic or Republican Party) on counties of the 2016 election given specific features. After preprocessing the data, creating features, and running cross validation, we acheived 77.3% prediction accuracy on an unknown test dataset of other counties.

Contributing Factors to a Country's Happiness

I, along with two partners, attempted to answer the following questions about the data collected by the World Happiness Report: does a country’s income level affect the average level of positive or negative feelings, which features have the greatest impact on a country’s happiness and how well can we use these features to predict a country’s happiness, can we make predictions about future happiness levels based on the happiness levels over time, and do countries with lower levels of happiness have more variability in their happiness levels?
We quantified a relationship between positive and negative affect and income level, identified the variables that affect overall happiness the most while creating a linear model, and forecasted happiness levels for a few countries for the next two years while exploring the relationship between the variability of happiness and the average happiness.
You can see the detailed analysis by clicking below:

Cornell Volleyball Website

This is a dynamic website I created from scratch in Visual Studio Code, with the goal of connecting Cornell Volleyball recruits, alumni, and fans using HTML, PHP, CSS, JavaScript, and SQL. It includes an interactive online photo gallery backed by an SQLite Database, recruiting sticky form with feedback, server-side form validation and input sanitization, contact page, schedule, and much more. Throughout the project, I used my skills to translate client/customer requirements into a working implementation while leveraging design patterns to improve site usability.

What I'm Learning

Programming/Languages

Python, SQL, Java, CSS3, HTML5, JavaScript, R, MATLAB, PHP

Operations Research Modeling Techniques

Tools: SQL, GIS, Excel, Visual Basic programming, and programming in scripting languages.
Methods: multiple linear regression, classification, logistic regression, clustering, time-series forecasting, and design and analysis of A/B tests.

Statistics

Random variables, probability distributions, density functions, expectation and variance, multidimensional random variables, important distributions, hypothesis testing, confidence intervals, and point estimation using maximum likelihood and the method of moments.

Data Science

Machine Learning topics: regularized linear models, boosting, kernels, deep networks, generative models, online learning, and ethical questions arising in ML applications
Data Mining topics: building and interpreting various statistical models, Naive Bayes, graphical models, multiple regression, logistic regression, clustering methods, and principal component analysis.

Networks, Crowds, and Markets

Analyzing networks and human behavior. Learning to construct mathematical models for and analyze networked settings to made predications about behavior within systems and learn to design systems to exhibit desirable behavior.
Ex: social networks, peer-to-peer filesharing, Internet markets, crowdsourcing, instrumental variables, regressions with qualitative information, heteroskedasticity, and serial correlation

Business

How finance, marketing, accounting, and operations can affect business decisions.
Topics: microeconomics, marketing, financial accounting, finance, business simulation, and career goals